WM Technology (a.k.a. Weedmaps) | An Introduction
Interested in exploring high quality companies with exposure to the rapidly growing Cannabis sector? Look no further than WM Technology. This Company has built a powerful platform with multiple future levers to pull for monetization. While current prices don't support an attractive bet, read on to learn what this company is up to so you are ready to act if share prices adjust!
Current Price: $15 / Price Target: ~$7 (May 2021)
Situation Overview:
§ Weedmaps Holdings (“Weedmaps”, “WMH” or the “Company”) is an online listings business exclusively serving the Cannabis industry. Weedmaps is a two-sided marketplace which publishes business listings pages for cannabis retailers, aggregates customer reviews and provides a marketplace to facilitate consumer purchases of Cannabis products. The “Customer” is the individual consumer who visits the weedmaps.com website or mobile app (demand-side), the cannabis retailers listed on WMH’s platform are “Clients” (supply-side).
§ On December 10th 2020, a SPAC backed by Silver Spike Capital (Silver Spike Acquisition Corp) announced the acquisition of a non-controlling interest in Weedmaps. The SPAC invested ~$250mm of proceeds for what will be a ~17% interest in WMH (15% on a fully diluted basis) which effectively valued the business at ~$1.4bn (12x 2021E Revenue and 48x 2021E EBITDA).
§ Since announcement, the SPAC shares rocketed to a peak of ~$28/share in Feb 2021 as the market reached fever pitch from pro-cannabis statements such as those made by Senators Booker (D-NJ), Wyden (D-OR) and Schumer (D-NY) regarding comprehensive Cannabis reform.
§ The stock has re-entered the atmosphere and is now trading in the ~$14-16 context of late, with a painful trailing 1 month performance at time of writing (May 2021) of -30%.
§ Despite the increasingly attractive price movements for those who fancy themselves contrarian, the stock is still too expensive.
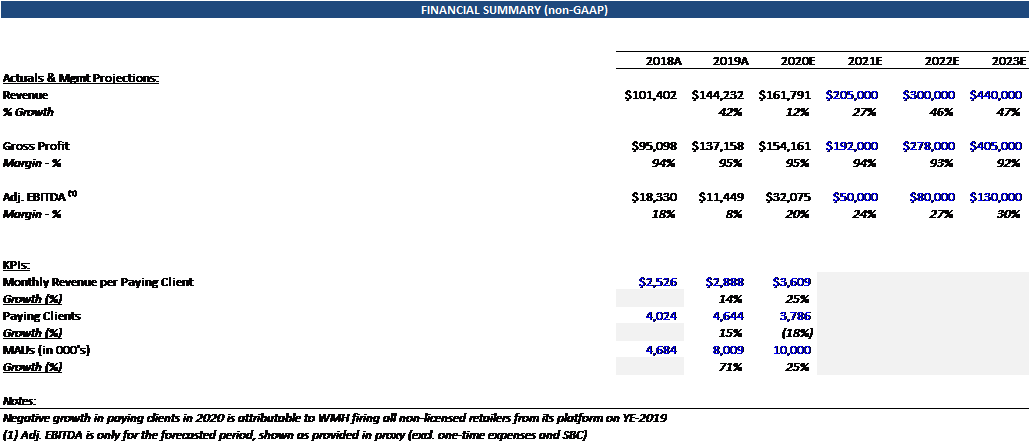
§ Today WMH is a ~$150mm revenue business (75% advertising) generating ~$30mm in EBITDA (20% margins), with minimal capex due to the software nature of the business.
§ WMH has ~4k paying clients which generate on average ~$3,200 per month in revenue, and monthly active users (“MAU”) (i.e., the consumers) of ~10mm.
§ The Weedmaps story ultimately hinges on two factors (i) the rate of client count growth (i.e., how many clients can WMH get to advertise on the platform) and (ii) what monthly ad spend can WMH generate from that client base (currently ~$2,700/month).
§ Throughout the rest of this report, I’ll outline my thinking as to why I believe the answers to these questions don’t substantiate an allocation in my own portfolio at these prices, but why this high-quality business is deserving of ‘watch list’ status.
§ I am looking to underwrite the business that exists today, and not backstopping value with visible, yet highly uncertain growth opportunities (marketplace monetization and international expansion).
§ I think WMH is a buy at ~$7/share.
§ The rest of this report is intended to orient the reader with a summary of the industry dynamics, business model and key underwriting questions as I see them.
Industry Overview:
§ First and foremost, cannabis is still considered a Schedule I drug under the Controlled Substances Act. Schedule I drugs are determined to have no "currently accepted medical use" and thus, on a federal level, are only permitted to be used in the strict context of medical research. A side effect (pun intended 😊) of the Schedule I status is the unfavorable tax treatment related to the sale of these drugs, which essentially caps expense deductibility below the COGS line (i.e., no deductions for R&D, S&M, G&A, etc.) for businesses which are involved in the trafficking of Schedule I substances, such as cannabis retailers.
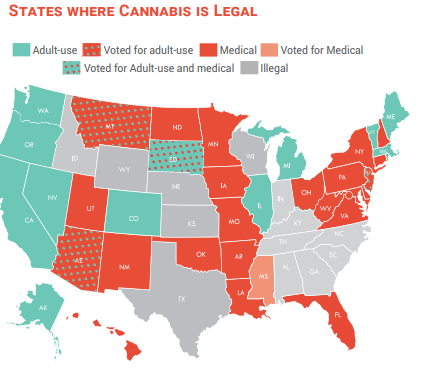
§ Despite the illegal federal status, Cannabis legalization has been picking up speed at the state level. At the time of writing, Cannabis is legal for recreational consumption/use in 11 states which represent ~28% of the U.S. population, according to Census data. In connection with the 2020 election cycle, 4 states announced successful ballot initiatives to legalize Cannabis for recreational use (AZ, MT, NJ, SD), bringing the pro forma legal recreational state count to 15, representing ~34% of the population. Below is a visual snapshot of the current legalization status by state:
§ Cannabis as a category has realized significant improvement in perception amongst the American populous. A Gallup poll in 2020 (below) indicates that acceptance of Cannabis legalization has never been higher, with 68% of the population supporting legalization. These endorsement levels suggest that federal cannabis legalization has really evolved into a question of “when” not “if.
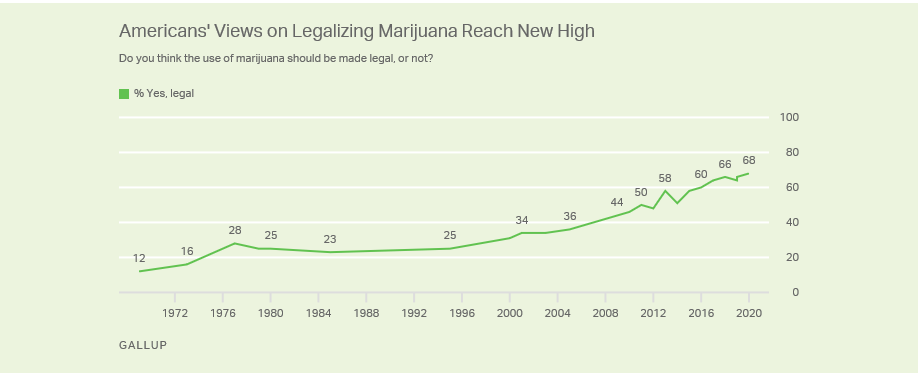
§ While you can see population approval has risen consistently in recent years, this has not translated to likewise improvement in usage, with only ~12% of Americans using Cannabis products. Even with an increased legal state count, adoption rates have remained largely flat. It will be interesting to see how this changes over time when there is less dichotomy between local and national regulatory regimes. Beyond the low penetration, Cannabis retailers also face significant opportunity (or difficulty depending on your lens) with brand awareness amongst users. Polls suggest that >50% of cannabis consumers couldn’t name a favorite brand. Niche advertisers like WMH (and investors like me) are licking their lips knowing that the war for consumer mindshare will likely wage for years with massive ad dollar casualties.
§ The confluence of these circumstances (building regulatory momentum, Democratic federal leadership, massively underpenetrated consumer market and low brand awareness of existing consumers) create an incredibly attractive industry backdrop for cannabis companies, and for Weedmaps in particular.
§ Now, onto the business model.
Business Model:
§ Weedmaps makes money in two ways: (i) sale of B2B solutions and (ii) advertising.
§ WMH’s B2B solutions are referred to as the ‘Business-in-a-Box’ (“BiaB”) bundle. WMH sells access to a suite of products including: a premium listing page, menu integration on the WMH website, a Point-of-Sale product for the physical retail location (which is designed to help facilitate real-time inventory updates), access to wholesale purchasing, logistics and fulfillment software for delivery services, and a white-label website for the local retailer to establish their own online presence.
§ WMH charges ~$500 per month for this product, serving as a source of monthly recurring revenue (although not long-term contracted). BiaB contributes ~25% to revenue and there appears to be very low churn for this product. The BiaB segment serves as a strong backbone for WMH by (i) positioning and integrating the business amidst the transaction process between the retailer and consumer and (ii) creating sticky client relationships with retailers to ultimately cross-sell advertising solutions.
§ The advertising business at WMH is essentially a Featured Listing product which offers front-and-center retailer placement on the Weedmaps webpage for traffic that is geographically relevant. Clients who pay for this prominent ‘real estate’ expect more impressions and ultimately transactions from local customers who visit weedmaps.com (or the app).
§ Retailers will pay WMH every month to advertise because of WMH’s ability to aggregate user traffic much more cost-effectively than the long-tail of individual retailers ever could.
§ The massive user traffic base cultivated by WMH is structurally attractive because those visiting weedmaps.com are customers that bring extremely high purchase intent, which leads to robust conversion rates down the funnel (from traffic -> leads -> placed orders). The value generated here (as compared to say out-of-home billboard advertising) is differentiated because WMH is directing consumers at the bottom of the purchase funnel and can eliminate advertising dollar waste on impressions who will likely never buy the marketed product. Since 85%+ of the population doesn’t consume cannabis, the lion’s share of untargeted impressions deliver limited value to advertisers.
§ This dynamic accrues to WMH in the form of higher pricing for its advertising products because it provides retailers with targeted, measurable, and attributable feedback on the advertising dollars spent.
§ The nature of WMH’s business model leads to high degrees of operating leverage and incredibly attractive incremental unit margins. The cost of WMH to serve up an add’l ad to a consumer is zero, so the more clients who pay to advertise through WMH generate nearly 100% flow-through margins. This dynamic obviously works just as powerfully in the reverse, if WMH were to start bleeding clients, earnings and cash flow would see near dollar-for-dollar reductions with the top-line.
§ The inherent risk of any advertising reliant business is the size of your clients’ ad budgets. Since advertising is a sizeable discretionary part of the cost structure for any retailer, it is the easiest and most frequently cut line item during economic hardship or uncertainty. As such, the spend and budget allocated to WMH by its clients will always carry a disproportionate risk of reduction during the next financial pullback, relative to other business service providers.
§ WMH plans to roll-out a pay-per-click (PPC) revenue model for its advertising business which will evolve into the business into more of a performance marketer. In my view, this transition presents some risk mitigation to WMH when ad budgets inevitably face scrutiny. Currently, WMH generates a 5-7x Return on Ad Spend (ROAS) for its advertising clients (i.e., each ad dollar spent generates ~$5-7 of sales for a retailer). Thus when managers at cannabis retailers are asked to trim ad budgets at future points in time, those employees will have to exhibit a much higher pain threshold to cut spend to WMH knowing the resultant top-line impact it will create. Assuming the Company can maintain its 5-7x over time, I expect that retailers will become increasingly reliant on this platform to drive sales and grow their business.
§ The more time I spend thinking about this business, the attractiveness of an investment in WMH can be boiled down to a view on two questions: (i) What is the rate of new client growth ? and (ii) What will run-rate advertising spend per client look like? What follows is my view on those two questions, and how they translate to value.
What is the Ceiling on WMH’s Client Potential?
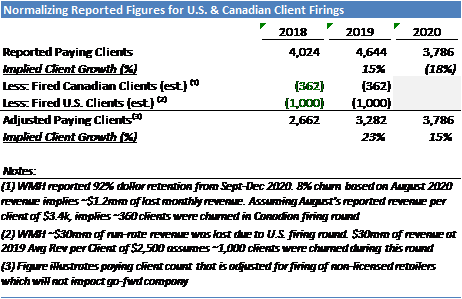
§ Before talking about the future, let’s take a quick detour into the past. WMH has faced challenges with its customer base in recent years in both the US and Canadian markets. In 2018, California underwent a regulatory transition during which Cannabis retailers were allowed to operate with temporary licenses which drove a boom in the number of new dispensaries. As the dust settled, it became apparent many of these temporary licenses were not getting transitioned to permanent licenses. The upshot for WMH was nearly ~1,000 paying clients who were now considered “illegal” or “unlicensed” retailers in the eyes of the state. WMH did not act particularly swiftly on this issue. Expiration of temporary CA licenses occurred during 2H ’18, and WMH did not fire those clients until YE-2019. By my estimates, this resulted in the loss of ~25% of their customer base and a ~$30mm run-rate revenue impact heading into FY 2020.
§ WMH faced a similar conundrum in its Canadian listings universe (non-licensed operators featured on the platform). Ultimately, WMH made the conforming choice to kick illegal retailers off the website starting Q3 ’20. I estimate the Canadian purge resulted in a loss of ~360 clients and ~$20mm of run-rate revenue.
§ While these actions were undoubtedly painful for mgmt., these decisions will prove critical for two reasons: (i) the move establishes that WMH is not a company willing to get sideways with regulators to maximize short term profit and (ii) reinforces platform validity and trust with consumers, who can rest easy knowing that WMH won’t guide them into improper retail channels. This also benefits the broader cannabis industry to not prop up illegal retailers and is a baby step to sustaining the legitimacy of a category with a reputation for its black-market roots.
§ Reported client counts at WMH without the above context show rather discouraging results in 2020. I see this client firing as a non-recurring event, and with the WMH platform cleaned up, the client base should be positioned for future growth. Below is a reconciliation illustrating reported paying clients and adjusting these figures to normalize out the non-licensed retailers.
§ The takeaway is that WMH has been able to grow clients organically (excluding non-licensed) at between 15-20% over the past two years. I expect this pace of growth to decelerate in years to come, here’s why:
§ When thinking about potential cannabis retailer count growth, its popular to point to the beer, wine and liquor market as an analog.
§ There is an important caveat to this base rate – the massive difference in penetration between the two categories (~50%+ of the population drinks vs only ~12% of the population who smokes). While this will certainly edge higher over time as the population shifts to consumers without cannabis stigma, that tide turns slowly.
§ This matters because the suggestion that cannabis retail density will come to rival that of the alcohol market is a highly aggressive baseline. A category with structurally lower demand will necessitate lower supply (stores).
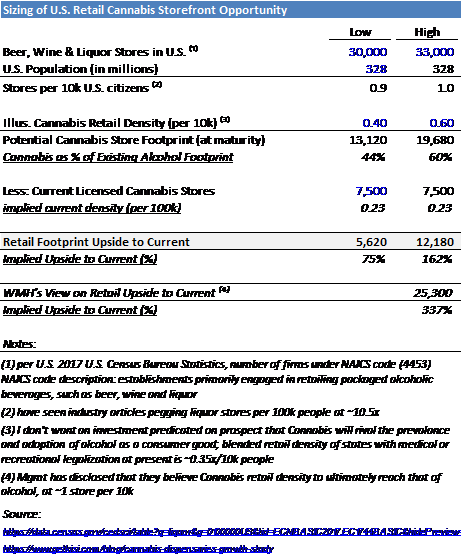
§ With that said, Census data suggests the alcohol retail footprint in the US has a population density of ~1 box per 10,000 people, implying a total box count of ~30-33k across the country. If we assume that in the next 10 years, Cannabis penetration gets to ~half the density of the Alcohol retail circuit, this would imply ~13-19k stores in the US. Today, estimates show there are ~7.5k licensed Cannabis stores, implying an incremental store count opportunity of 5-12k. Below is how the build works. Its worth flagging that WMH mgmt. markets the assumption that dispensary density can indeed match that of the Alcohol market, and uses that assumption in TAM sizing.
§ Based on the ~5-12k of potential retail clients which could enter the universe over the next decade, what are the financial ramifications for WMH? The following build assumes take-rates of 30-35% on new retailers (WMH claims 50% market share today) and holds ad revenue per customer flat to isolate the potential revenue impact solely from organic client count growth. My math suggests that over a 10-yr time horizon, organic client addition contributes annual revenue growth in the ~3-6% context.

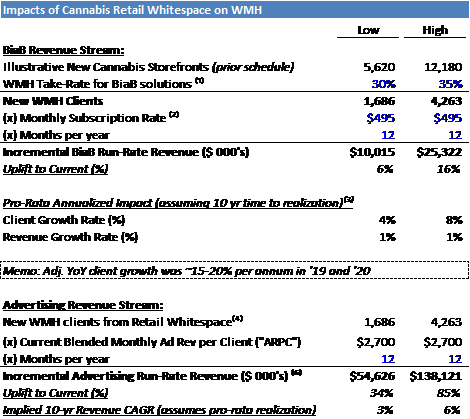
§ This is no trend to scoff at, but when the stock is pricing in annual growth rates of 40%+ for the foreseeable future, mid-single digit revenue growth doesn’t cut it. The other piece of the growth puzzle to be explored is the potential advertising revenue per client. The best way I thought to answer this question was by evaluating “what can dispensaries afford to spend on advertising?”.
What Can Dispensaries Afford to Spend on Advertising?:
§ WMH’s ad revenue per customer is going to be inherently capped by the advertising budgets of the long-tail of individual cannabis retailers. I view this calculus as an output of a few key variables: Ad budget intensity (% of revenue), Channel Mix (digital vs traditional media), and Share of Wallet (WMH’s digital ad products vs like competitors). The limitations of these exercises are the quality of the inputs, and absent customer polling data, I sought to extract and apply reasonable base rates based on my experience in the space. The below build starts with implied revenue per retail box of 3 leading publicly traded Cannabis retailers (Green Thumb, MedMen and Acreage). Based on their individual filings, the implied monthly revenue per box is somewhere in the $300-800k range (I’ve tried to normalize these figures as best I can to avoid distortion from inorganic growth at the retailer). On the far right of the build you’ll see a column for “industry average”, which based on several independent sources, pegs the avg monthly revenue of US cannabis retailers at ~$250k per month (well shy of the more scaled public players, unsurprisingly).
§ I then assumed that a retailer spends ~6% of their revenue on advertising which is a bit high relative to benchmarked traditional brick-and-mortar retailers but in the zip code of WMH mgmt commentary that “80% of WMH clients are spending less than 6% of revenue on marketing”.
§ Next I’ve assumed that ad budgets allocate ~75% to digital mediums. The basis for this is anchored to fact that ~50% of US corporate ad budgets are now spent on digital channels (according to eMarketer). I’ve skewed higher for cannabis retailers as traditional print and TV channels are not available due to the federally illegal status of goods sold. As such, retailers have much fewer options and digital is an inherently stronger channel than ‘out of home’.
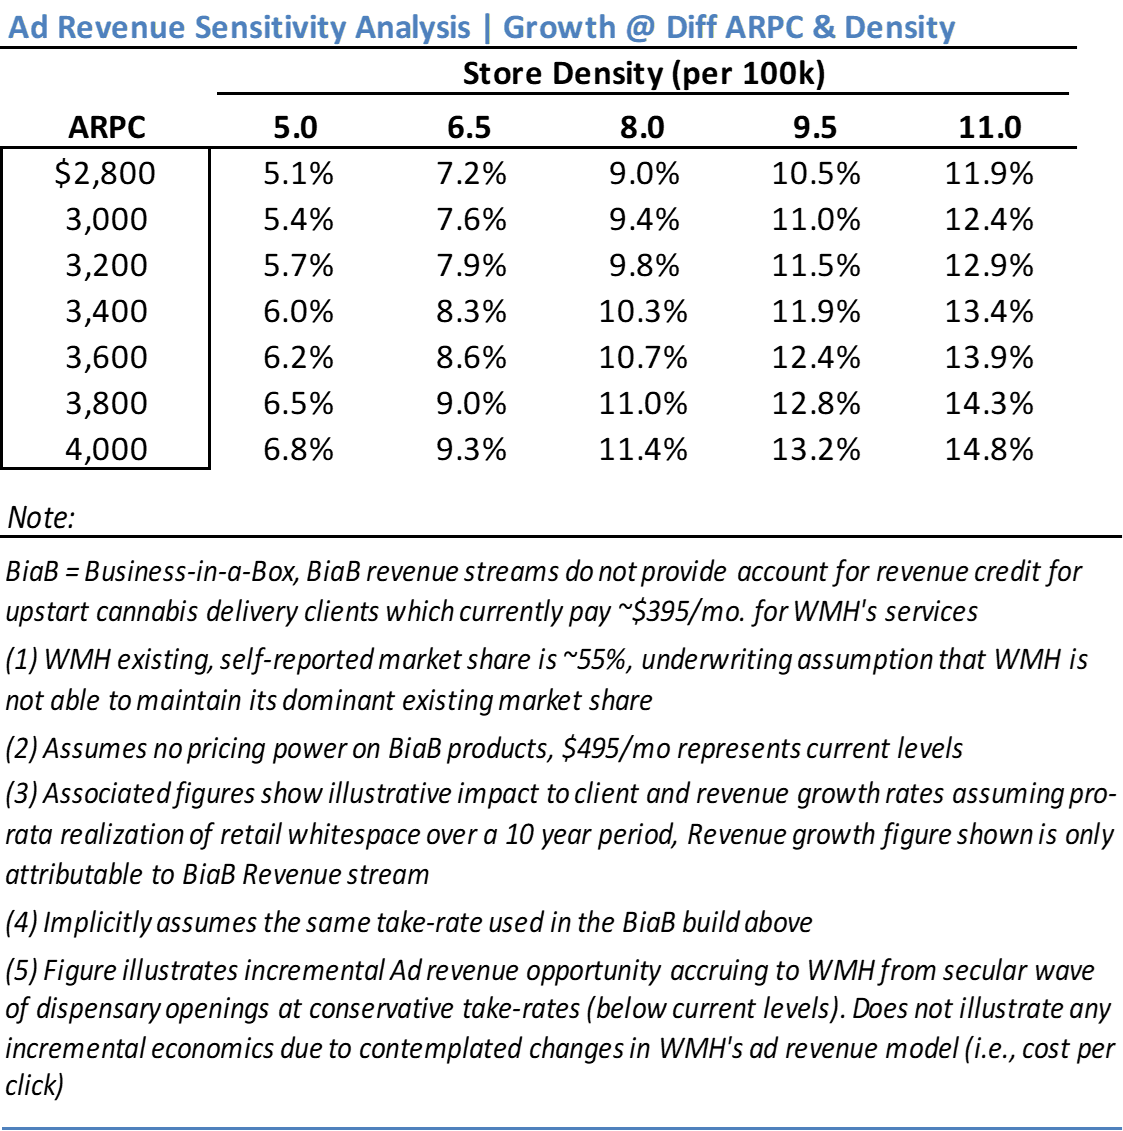
§ The last piece is solving for the share of wallet WMH takes amongst digital ad spend. This is very opaque, but at this point am assuming ~25-35%, based on: (i) WMH has another digital marketplace competitor (Leafly) of similar scale, (ii) reserving illustrative budget allocation for brand awareness campaigns which are more germane to social media channels and (iii) an increase in PPC / performance marketing competition from the likes of FB and Google as the category matures/legalizes. While some of these competitive drags aren’t active today, it seems imprudent to ignore these looming threats when thinking about ad revenue potential over a 5 year time horizon.
§ I’ve spilled so much ink to outline the economics here for two reasons: (i) this is, in my view, the most important variable in the valuation story for WMH. The view on Ad revenue per customer can single-handedly alter the perception of this name from a “bargain” to a “bust”, and (ii) it’s the part of my analysis where I think there could be valuable debate/disagreement and thus want to open myself up to those conversations with those who view differently. Below is the build which summarizes the commentary above:
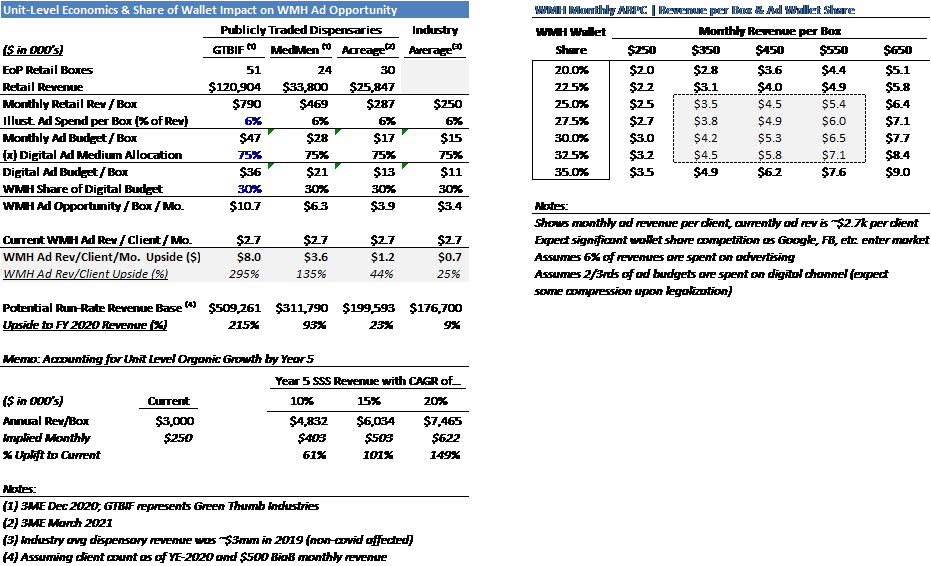
§ My takeaways from this analysis are as follows: (i) At current retailer performance, there is somewhere between 25-45% uplift in Ad revenue potential per client. Pointing to the highest grossing retailers as rationale for ad revenue ceilings is dangerous because WMH is driven by a very long-tail of clients. I’ve chosen to look at Weedmaps ad revenue per client potential from an industry midpoint as the Company will have clients with a distributed range of spend capacity. (ii) The bottom of the output shows the potential revenue per retailer box assuming a 5 year same-store sales (SSS) CAGR of 10, 15, and 20%. In recent quarters, I’ve seen retailers growing YoY SSS in 15-25% range (or higher). It seems appropriate to account for the trickle-down effects to retailer ad budgets as cannabis retailers continue to deliver strong same-store revenue growth. Assuming a 15% SSS CAGR over the next 5 years, this would imply monthly rev per box of ~$500, and if we take that variable up to the sensitivity table, you will see ad revenue potentials of $4.5k-5.5k per month (~66-100% uplift from current levels of ~$2.7k).
§ Thus when thinking about future cash flow generative ability, I am underwriting a ramp to these levels (~$5.0k per client per month, up from ~$2.7k at current). Customer cohort data is largely in-line with this as well as the more mature 2016 and 2017 cohorts are currently in the ~$4.5-5k per month zip code.
My Model and Views on Valuation:
§ I believe fair value for WMH is in the ~$6-7 per share context, a far cry from the ~$14-16 range it trades today. My view of fair value is based on the following summary drivers:
o Revenue of $355mm by ’25 (17% Rev CAGR), driven by client count and Ad Rev per Client CAGRs of 8% and 15%, respectively.
o EBITDA to $115mm and 32% margins by ’25 (23% CAGR, vs. 25% margins today)
o Req’d FCF yield in year 5 of 5% (implied Terminal EBITDA multiple of ~14-15x)
§ As mentioned in the opening section of this write-up, unproven growth narratives have not been factored into valuation. The strongest and most accretive growth vector for WMH, from my perspective, is the monetization of its marketplace, likely in the form of transaction or service fees charged to the consumer. Although the potential upside under conservative assumptions for Gross Merchandise Value (“GMV”) monetization is attractive, it likely doesn’t change my conclusion at current prices. As a sample illustration, assuming a conservative 3% take rate on WMH’s >$1bn of transaction value placed on the platform by consumers, and a contribution margin of ~80%, we are talking about another ~$25mm of FCF capitalized at a 5-6% yield is another $3/share. For the international opportunity, a conservative ~1,000 client base, $2,500 ad rev per month and 75% contribution margin offers another ~$2/share of upside.
§ To better understand what the market is pricing in, I put together an inverse DCF which suggests that today’s prices imply the following performance expectations at WMH:
o Revenue of ~$800mm by ’25 (38% Rev CAGR), which would imply client count and Ad Rev per Client CAGRs of 15% and 23%, respectively. Breaking this down one step further, If retailers do indeed spend on avg ~6% of sales on marketing, WMH will need high-teens retailer SSS growth from its entire client base and also maintain 30%+ wallet share for those clients over the next 5 years. Comparing this to any sort of reasonable base rate feels like a top quartile type of outcome (i.e., not much margin of safety).
o EBITDA of ~$300mm and 38% margins by ’25 (50% CAGR, vs. 25% margins today). While its not unheard of to reach these margin levels, you also find yourself in the rare air of digital ad companies like Facebook with these assumptions. Also from a cost structure perspective, you have to believe that in order to fund all this growth, product development spend will stay around the ~20% of revenue mark, which means most of this cost structure leveraging has to come from G&A. Today, G&A is very fat at ~40% of EBITDA, and while taking this down to 25% is doable at scale, I’m not confident this is as easily done on a revenue base that would still be sub ~$1bn.
§ Ultimately my conclusion is that Weedmaps is priced for perfection, and despite the attractive business model, mgmt. incentive alignment (mgmt. rolled 100% of their equity in the SPAC deal), and strong secular tailwinds, the upside:downside ratio here is mispriced. With ~$5 of potential intrinsic value upside from current (~$20/share, giving credit for unproven businesses) and potential downside of ~$10 (assuming rosy growth and margin assumptions don’t pan out), the $1:$2 gain:loss relationship here is not compelling.
Risks to the Thesis:
§ The Company’s shift to a pay-per-click (PPC) ad revenue model could drive clients to ramp up ad budget allocations and/or total spend. This is the risk I’m most concerned about; clients of WMH may begin to look at their ad spend much more aggressively than they do today if WMH is able to successfully scale its performance marketing offering. Clients who can directly attribute marketing spend dollars with accretive PPC bid levels to Weedmaps will likely shift relative and absolute dollar spend favorably for WMH. Right now, WMH is still early in testing out this revenue model in select markets, so some execution risk here remains.
§ Leveraging platform to increase monetization of sticky client relationships which drives higher than expected growth (add-on CRM / Loyalty products / delivery service / white label Cannabis sales)
§ WMH’s increasing brand and platform awareness enables faster growth than expected due to network effects in both new and existing regional markets (less ad spend required to drive user traffic and less S&M spend to attract clients)
§ Acceleration of purchasing behavior migration to legal channels from the legacy black market. This provides structural expansion of lead gen capacity for companies like WMH.
Catalysts Positive and Negative to look for:
§ Not many strong catalysts on the horizon, with the obvious exception of regulatory overhaul. Here are a few items which could create both upward or downward pressure on the stock in the next ~12 months.
§ Positive:
o Regulatory reform (outright federal legalization, SAFE banking act, continued state-level legalization) and subsequent capital flows by institutional investor community
o Reported client count growth which substantiates rosy growth outlook
o Faster than expected migration of demand from black market into legal consumer market
§ Negative:
o Fines and/or judgement from ongoing grand jury inquiry
o KPI misses and subsequent re-rate on expected revenue growth (sub 40%)
Entrance from established ad channels (Social, Search, TV, etc) creates pressure on implied $/impression or $/lead