Friday🔥11: Are You Shipping Me?
Welcome to the 1 new addition(s) to our Friday 🔥 community who have joined us since last week! If you aren't subscribed, join >100 smart & curious folks here:
Welcome to this week's edition of Friday Fire, an end of week newsletter recapping notable insights and inspirations from the past week. This week I'm unpacking the drivers behind the container shipping business. Think Tom Hanks in Captain Phillips, "I am the captain now!"

This post was the result of an inbound request from Scott, a regular reader of the blog. Scott was recently driving by a shipping port and found himself wondering how the container business worked and who is capturing the value from the recent spike in container rates.
Scott asked if I knew the industry, to which I candidly admitted, "Not really, but I'd love to dig in!". I LOVE getting input and questions like this. This post represents summary learnings from my time reading around the sector.
If you have curiosities or ideas which could be the subject of a future Friday Fire, shoot me an email, just like Scott did.
Without further ado, let's jump in!
Intro
This post is focused solely on the containership sector, and thus are ignoring adjacent shipping sectors such as dry bulk (iron, coal), liquid bulk (vegetable oil), crude oil and livestock shippers.
Containerships are responsible for transporting a wide array of products, from plastics to furniture and textiles to electronics. Every ship has a diversified product mix onboard.
Containers are standardized across a few different sizes. The standard industry container is a "twenty foot unit", commonly referred to as a "TEU". Remember this, you'll need it later. A ship's capacity is quoted in TEUs, or the number of 20 ft containers it can transport at once.
The size of the average industry containership is between 8,000-10,000 TEUs (i.e., can transport 8-10k of the 20ft containers in a single voyage). This is pretty astounding... think about how long it would take you to count to 10,000, much less stack up that many containers on a floating hunk of steel.
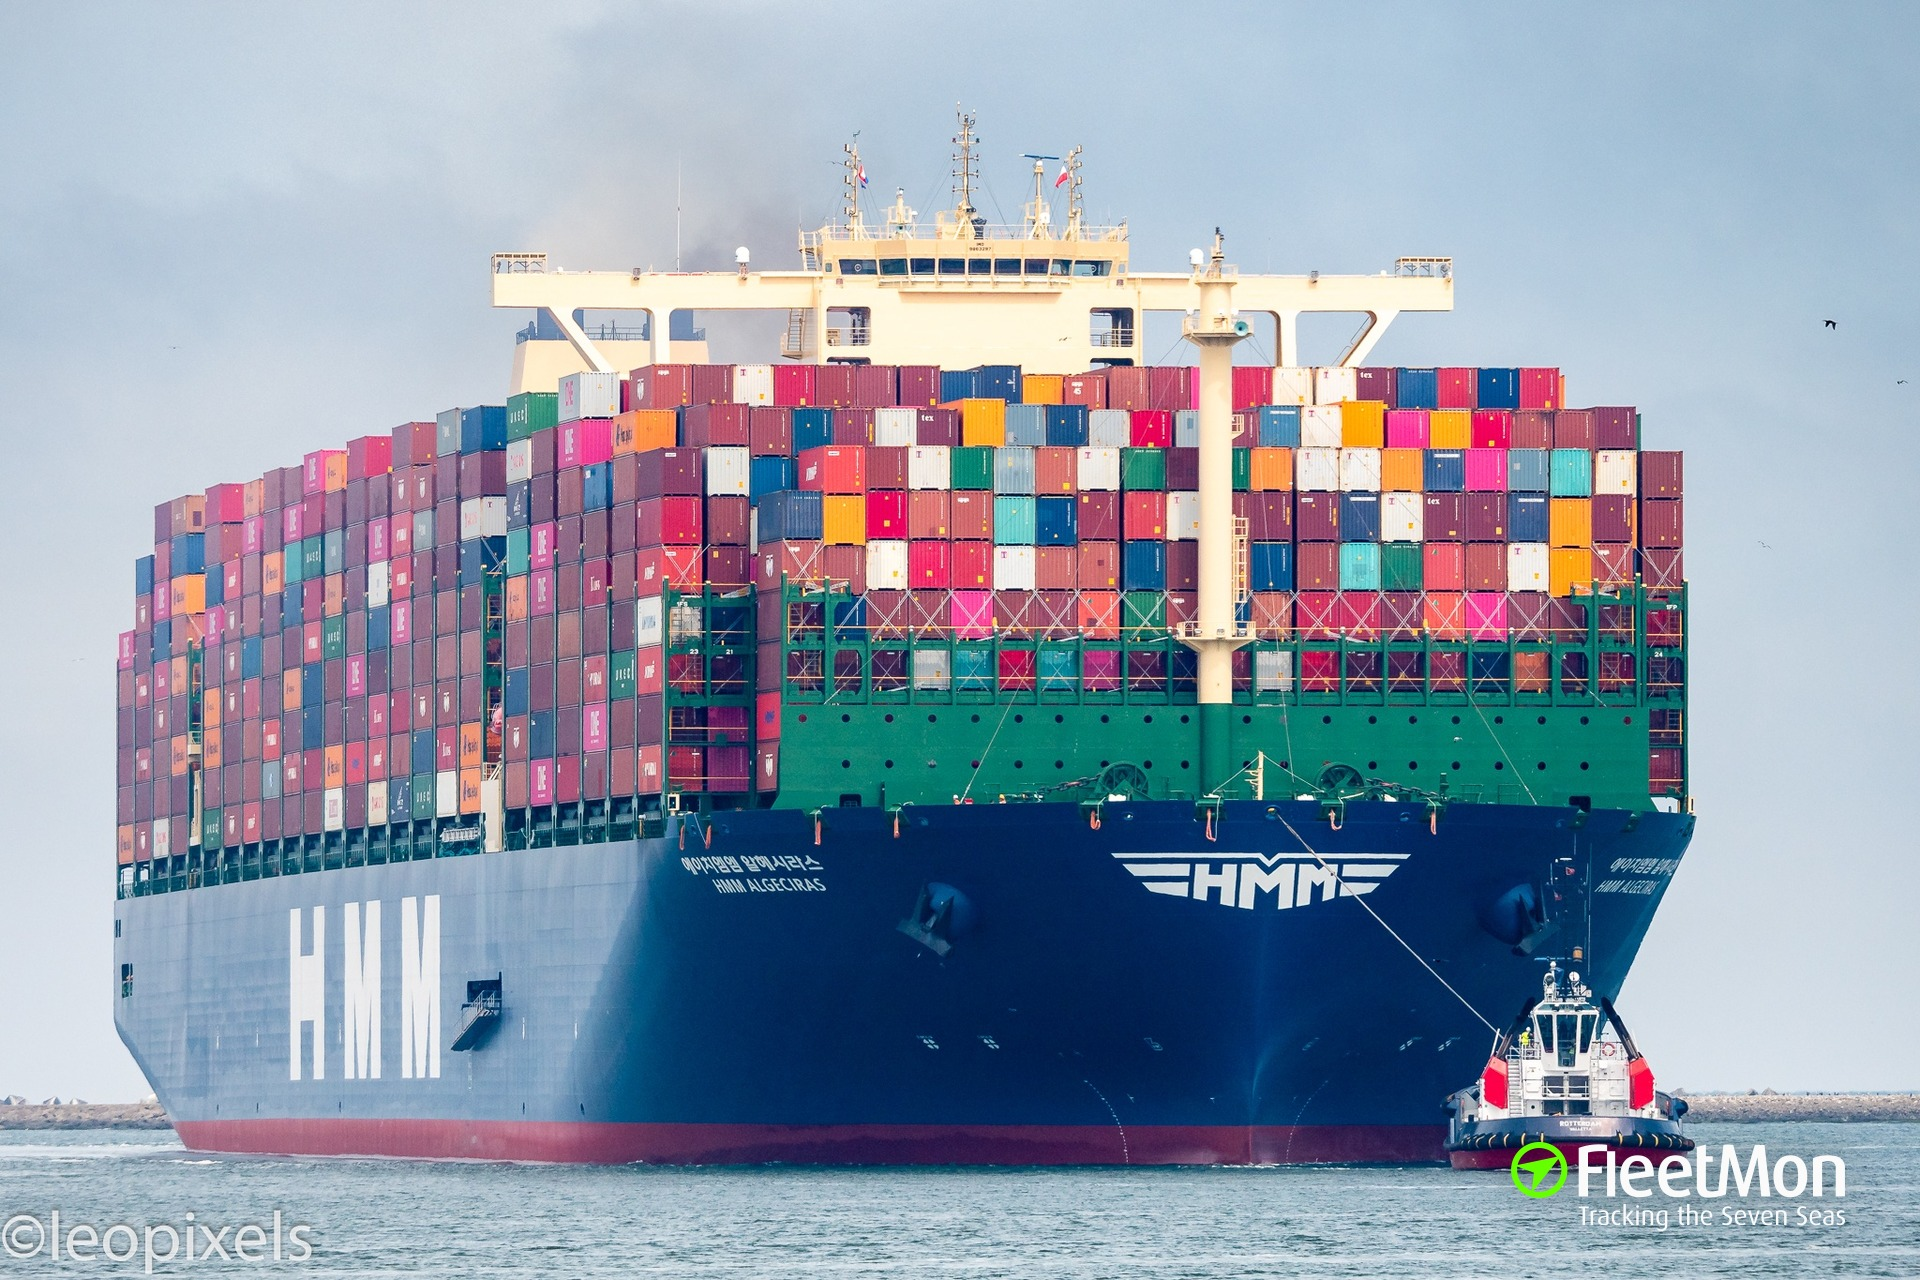
Continued innovation in this sector has taken containership capacity up to the 20,000+ TEUs, a picture of which I've included below.
Who Own's What? (Owners vs Operators)
The structure of the shipping industry is largely bifurcated into two business models: (i) the ship owners and (ii) the ship operators.
Ship owners are the direct customer of a ship yard (most of which are based in Korea and China), owners order new boats. Ship owners will then typically lease out their vessels to ship operators, who are take responsibility for filling and transporting the containers onboard.
The shipping industry uses the term "chartering" to describe the commercial arrangement where the ship owner leases out the ship to a ship operator. Ship owners will charge day rates which can be priced at either spot (current market price) or at a fixed rate for a multi-yr period.
As such, a pure-play ship operator is an asset-light business which does not own the ship and functions as an intermediary by leasing shipping capacity, and aggregating demand from customers who need product shipped.
The inspiration for this write-up originated from the crazy container rates which have flooded news headlines. The industry participants most directly affected by shipping rates are the ship operators, so that's where this write-up will focus.
The Business Model of a Ship Operator
Container shipping rates have tripled/quadrupled in the past year. In order to contextualize these headlines, let's first take a moment to break down the revenue and cost drivers of a ship operator.
Revenue
If we were to distill the revenue model for a ship operator into its simplest form, it would look like this:
Round Trip Container Shipping Rate (x) Avg Number of Containers (x) Number of Voyages per Year (x) Number of Ships Operated
During research, I have come to appreciate two powerful dynamics which heavily impact the profits of ship operators.
1. Dominant vs Non-Dominant Legs
A "Dominant Leg" in shipping describes the leg of a voyage where the ship is carrying the most cargo. Let's use the trans-pacific route as an example.
Everyone knows that a containership completing the leg from Shanghai to Los Angeles is going to have a structurally higher utilization compared to the reverse leg (LA -> Shanghai). China exports way more to us than we do to them.
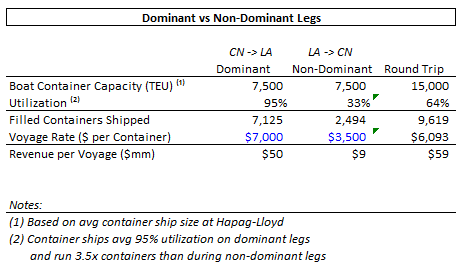
Thus, Shanghai -> LA is considered the dominant leg. Based on industry reading, it seems dominant legs for container ships will be filled 2.5-3.5x more than on the non-dominant leg.
Containership utilization on dominant legs has been at ~95% during the last two years, which would imply that on the non-dominant legs, a containership is only running at 30-40% utilization.
This lower utilization also greatly reduces pricing, as the rate per container can be 30-50% cheaper than the rate of the dominant leg. This is an important consideration when thinking through the round trip voyage profitability of these ships.
Here is a simple breakdown to illustrate the math. As you'll see, the lion's share of the ship operators revenue is coming from the dominant leg (70-80% of the voyage revenue).
2. Contract vs Spot Rates
As mentioned above, many ship operators lease or charter-in the vessels they operate.
To hedge their risk against unpredictable container rates, ship operators will turn around and sign long-term shipping contracts with customers at fixed rates. Whether the ship operator is entering into these agreements with a broker or directly with a customer (like Target/Walmart), the contractual $ per container rate gives the operator revenue visibility and helps protects the ship operator (positively or negatively) from fluctuations in future market rates.
After talking with an investor relations employee at Hapag-Lloyd (publicly-traded ship operator), he shared that the company has ~50% of its fleet capacity tied up in multi-year contracts.
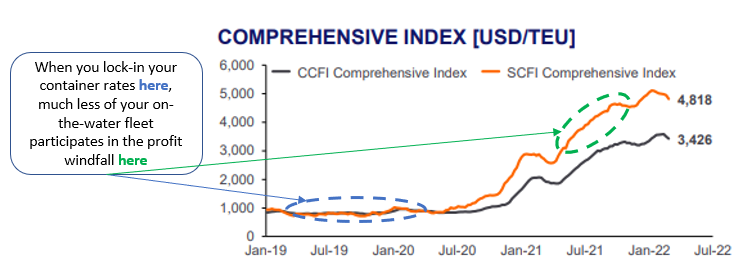
So while ship operators are well positioned to benefit from the surge in container shipping rates, the financial windfall may not be as exaggerated as you think given the contracting strategy of many vessel operators.
Below is an industry index of container shipping rates (blended avg across various global routes) to illustrate the magnitude of the recent surge. The benefits of the current pricing cycle go disproportionately to operators with uncontracted fleets.
Now let's flip to the cost side of the business to examine, how much of the container rate uplift these companies get to keep.
Cost Structure
The cost structure of a ship operator is comprised of four main buckets: fuel, handling, equipment and vessel costs. Here is a brief description of each bucket:
Fuel - commonly referred to as "Bunker" in the industry, this is simply the cost of fuel oil used to power the vessel during its voyage.
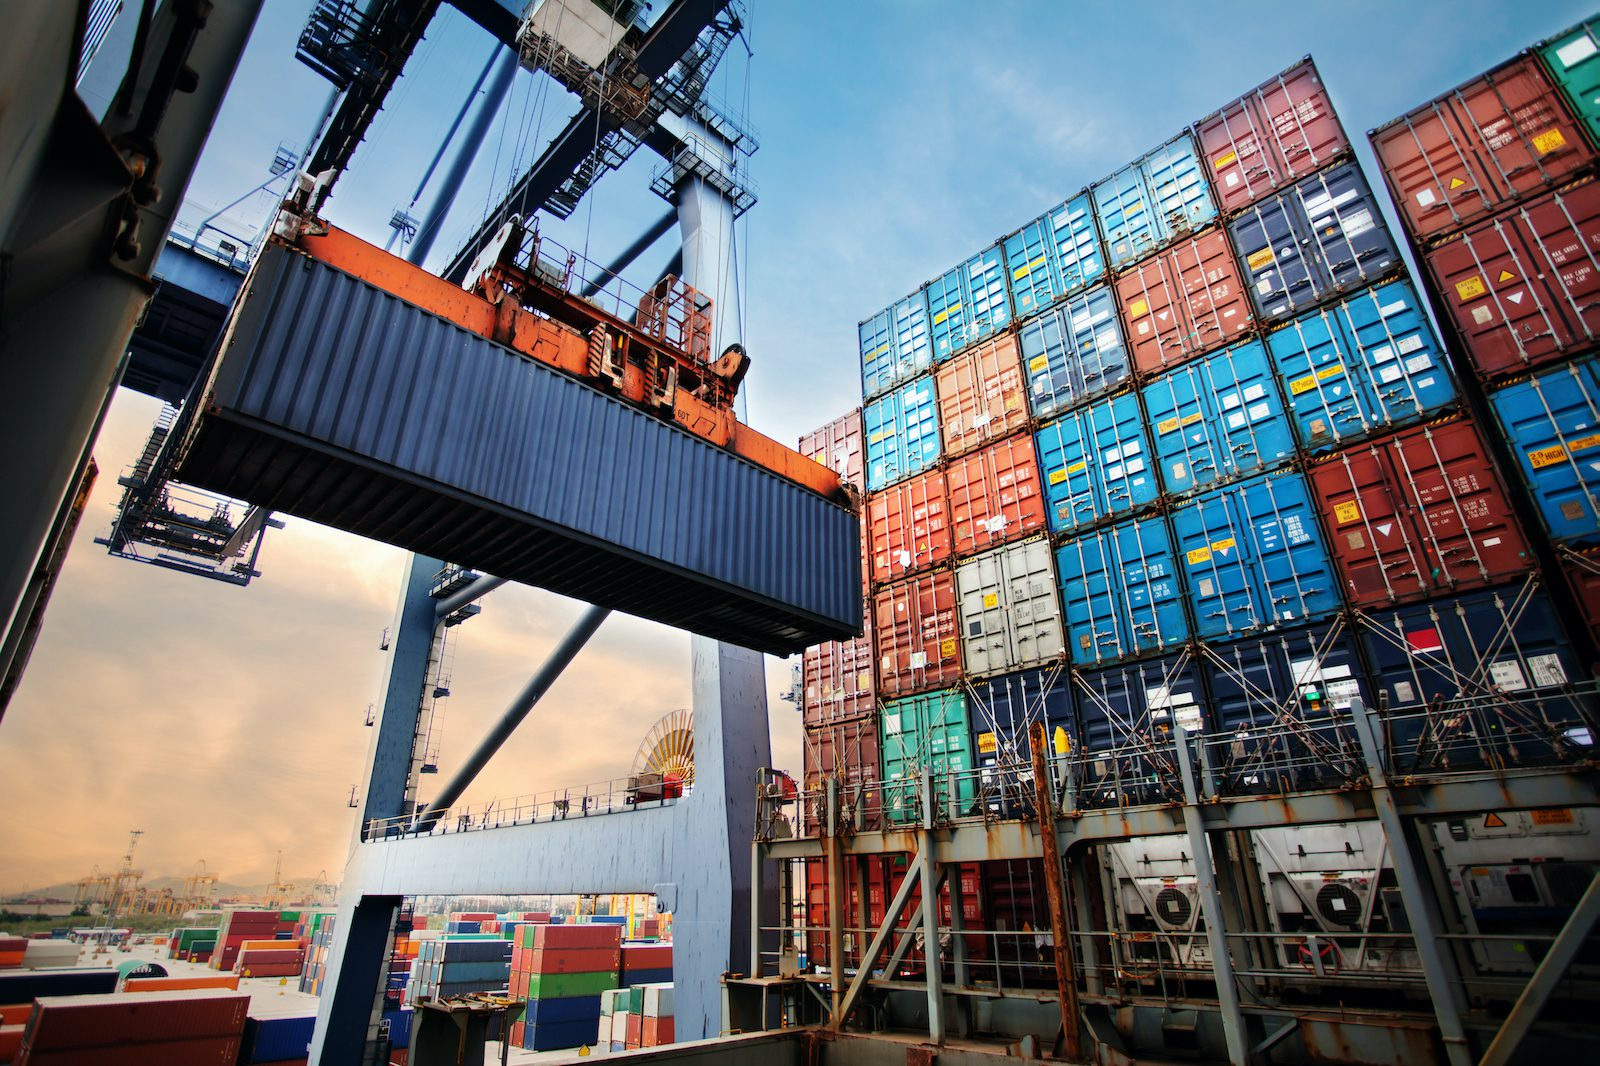
Container Handling - represents cost incurred by the ship operator to get containers loaded on and off the vessel while in port. This comes in the form of fees to the port operator to use the necessary cranes and personnel.
Equipment - ship operators sometimes rent their containers, this cost bucket represents rental fees and costs associated with maintaining a large fleet of containers.
Vessel - cost to lease (charter) the vessel, along with maintenance and repair costs
You'll notice that any mention of 'personnel expense' is absent here. The cost of staffing maritime crews to operate these vessels is inconsequential to a ship operators P&L.
Digging deeper into these expenses, its clear that these costs are driven by volume (not price). For example: fuel/bunker costs are driven by the number of voyages, container handling is driven by number of containers shipped, equipment and vessel are based on number of containers and ships rented.
None of these costs are directly correlated to price.

As such, when the industry sees a spike in price, ship operators are positioned to rake nearly all the profit because costs are driven by the number of vessels and containers.
This same dynamic which greatly favors the shipping industry at present, works powerfully in reverse as container shipping rates crash and operators start to bleed cash.
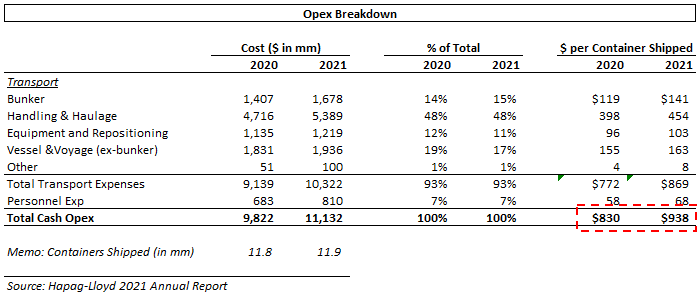
Below is an illustration of the cost structure from Hapag-Lloyd (public shipping operator referenced earlier). As you'll see, the cash cost of shipping a container at Hapag-Lloyd went from $830 per TEU in 2020 to $940 in 2021. A modest 13% increase, while shipping rates jumped 300%+ (depending on the route/region).
End Note
Shipping, like other commodity industries, is highly cyclical and is a business which lives and dies by prevailing pricing. This leads to 'feast or famine' dynamics, and right now, ship operators are feasting.
However long these supply constraints last, it is sure to be followed by a period of pain. Many ship owners are already queuing up big orders from to add new ships to their fleets.
Look at the return profile of investing in a new ship at current container rates (and compared to the implied return at 2020 container rates)...
Right now, all ship owners are hearing the siren song of a ringing cash register, even though it destines the industry to revert to a period of lower prices in the not too distant future.
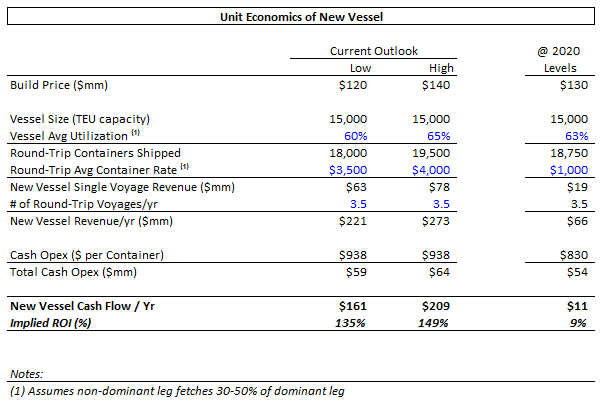
Despite the hefty price of new 15,000 TEU vessels ($120-140mm per ship), current shipping rates support the investment.
Its a great time to be in shipping, but to those paying attention, a reversal is just a matter of time.
Gratitude
Gratitude helps cultivate a sense of joy and appreciation along the way, and need not be reserved for the big or elaborate happenings in life.
This week I'm grateful for the gift of choice. The ability to choose is quite the undappreciated freedom
What are you grateful for this week?
Update on Stock Picks:
The markets have been scorched in the past week (this week the S&P was down 5% and the tech-oriented NASDAQ down 8%). This brings year to date (YTD) performance for each index to -18% and -27%, respectively.
So far my picks have held up fairly well on a relative basis. MAPS gave back all its gains and is again flirting with ~$5/share. I added to my MAPS position this week amidst the sell-off as my conviction on this name remains high.

If you enjoyed this, please share with 1 person you think may enjoy it too! It'd mean a lot to me!
Until Next Week,
Ryan ✌️